Operation and Performance at a Glance
The ‘Operations and Performance’ dashboard-card intends to provide a quick overview of your most important performance and operations events, alarms and anomalies.
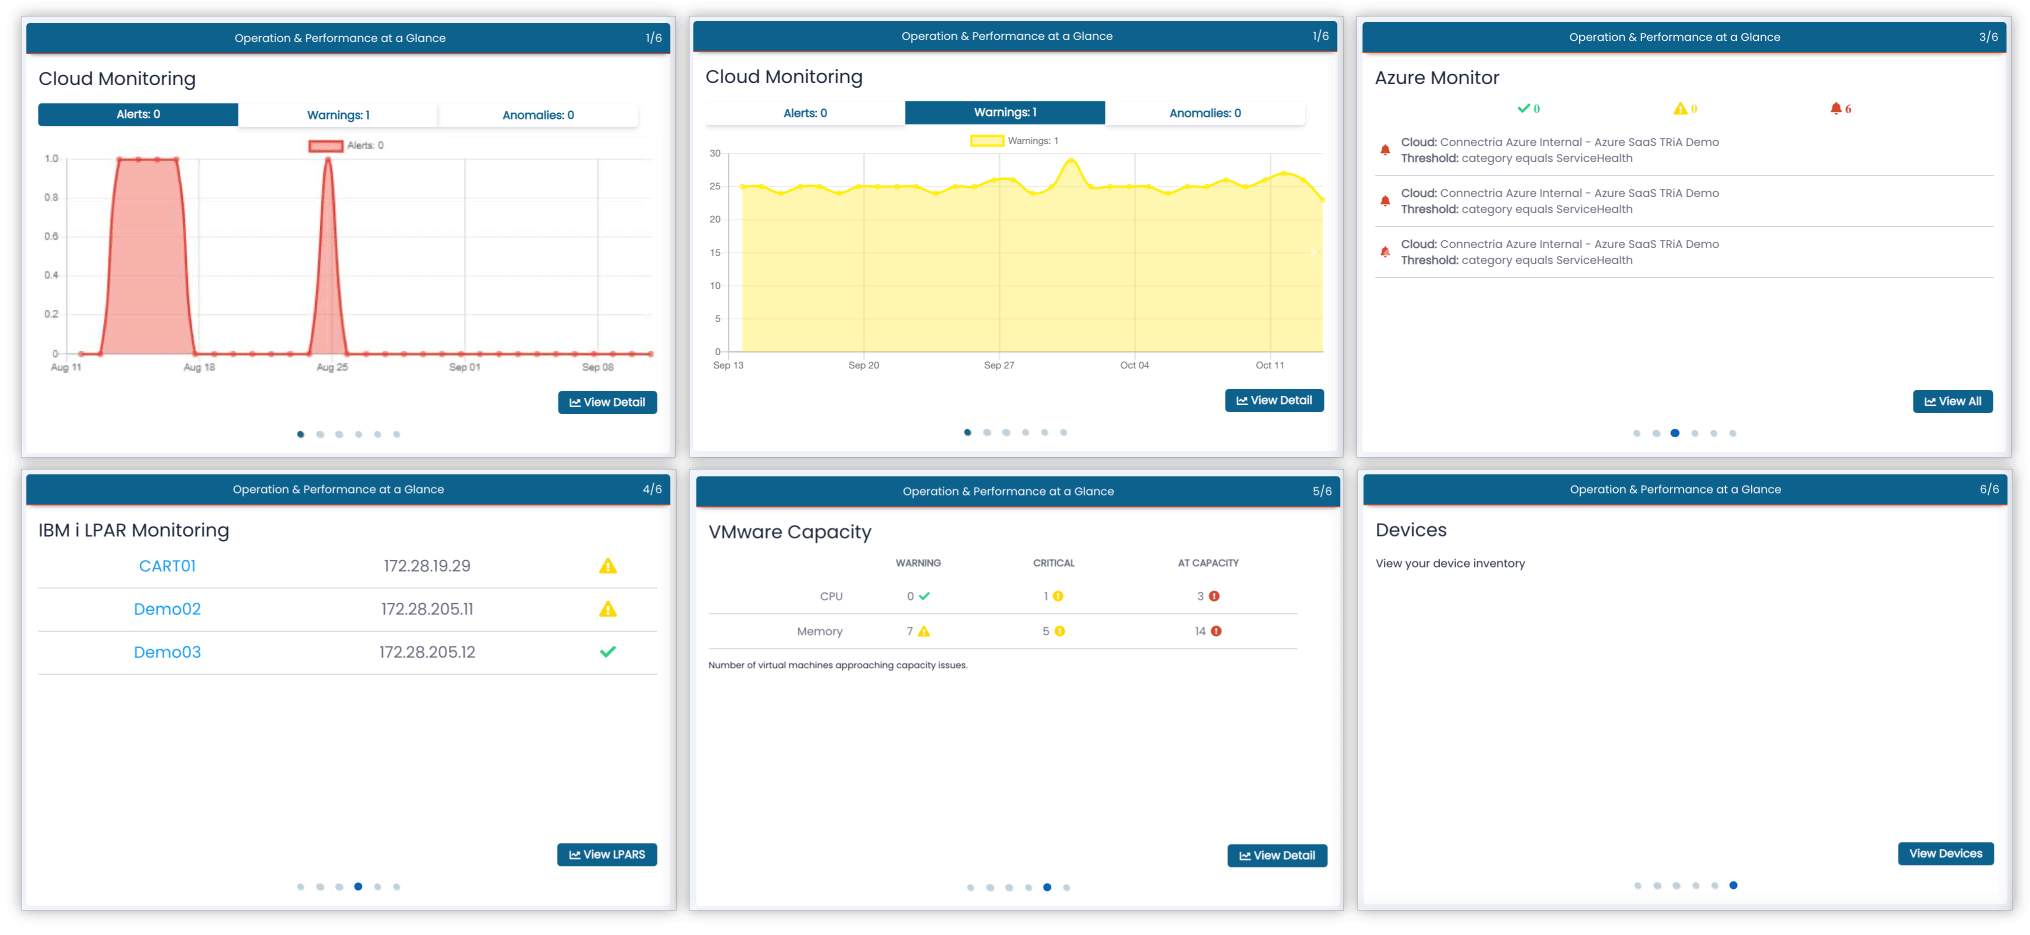
Cloud Monitoring
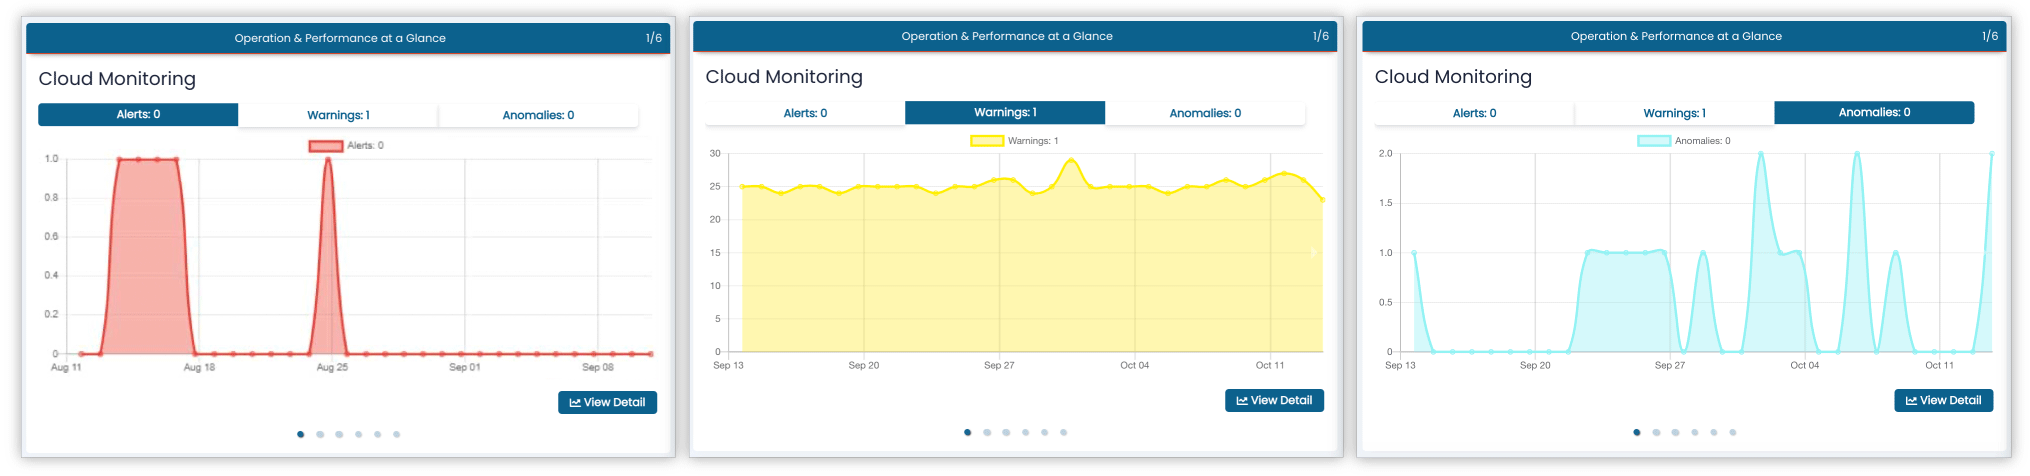
The Cloud Monitoring card provides a tally of last month’s performance most important lifecycle, performance, health check and task events. These can include:
Detected anomalies such as performance or workload outliers,
Warnings including covering stopped or running tasks, or timed out functions
Alerts such as failed health checks, passed thresholds, or exceeded task limits
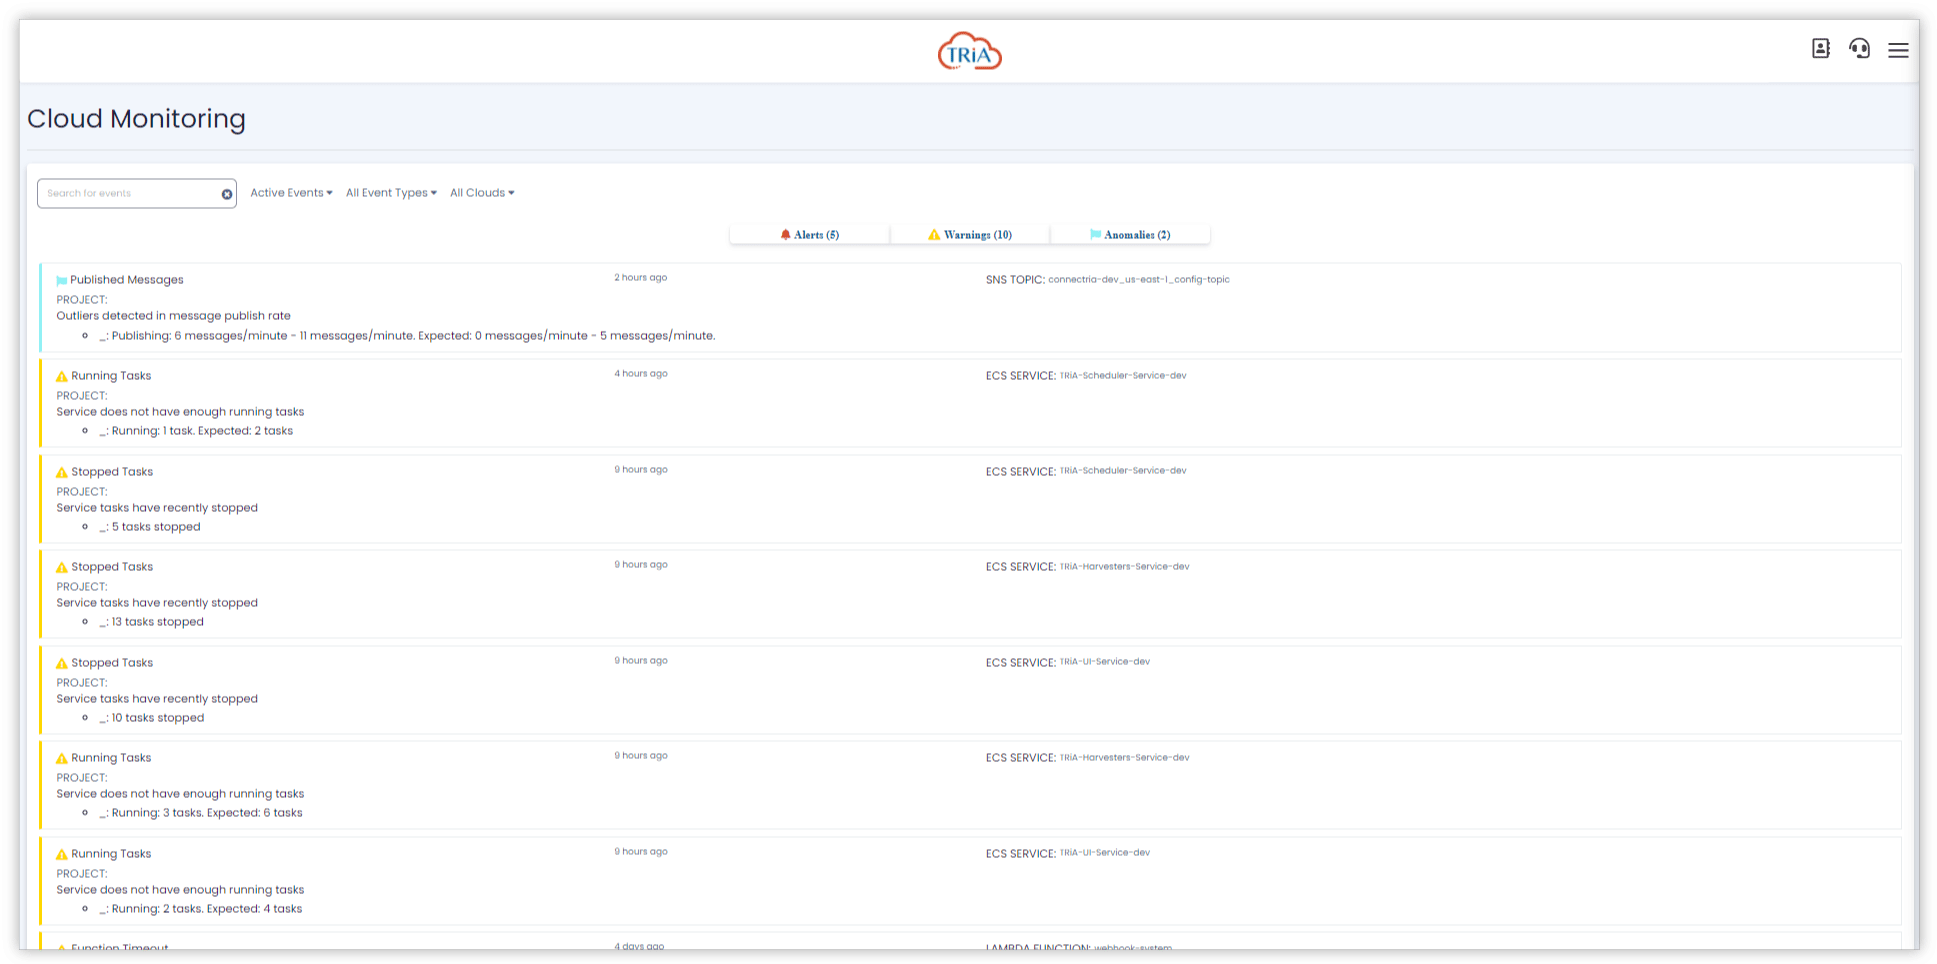
A detailed list of events is available via the ‘View Details’ button:
Cloud Watch Alarms
CloudWatch Alarms display both metric and composite AWS CloudWatch Alarms, Warnings and passed checks.
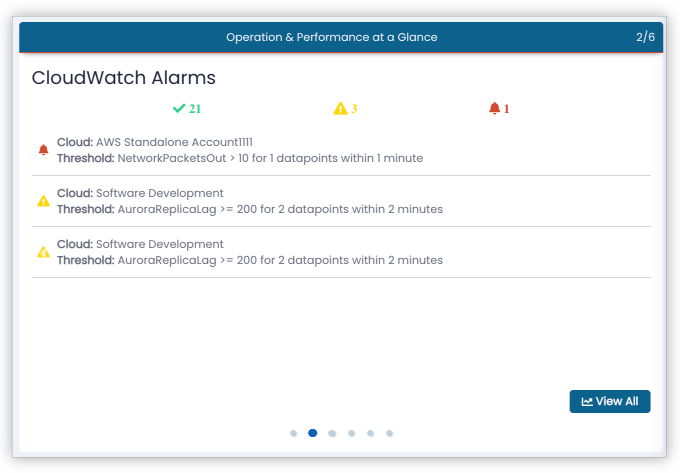
A comprehensive list of CloudWatch alarms is available via the View All button.

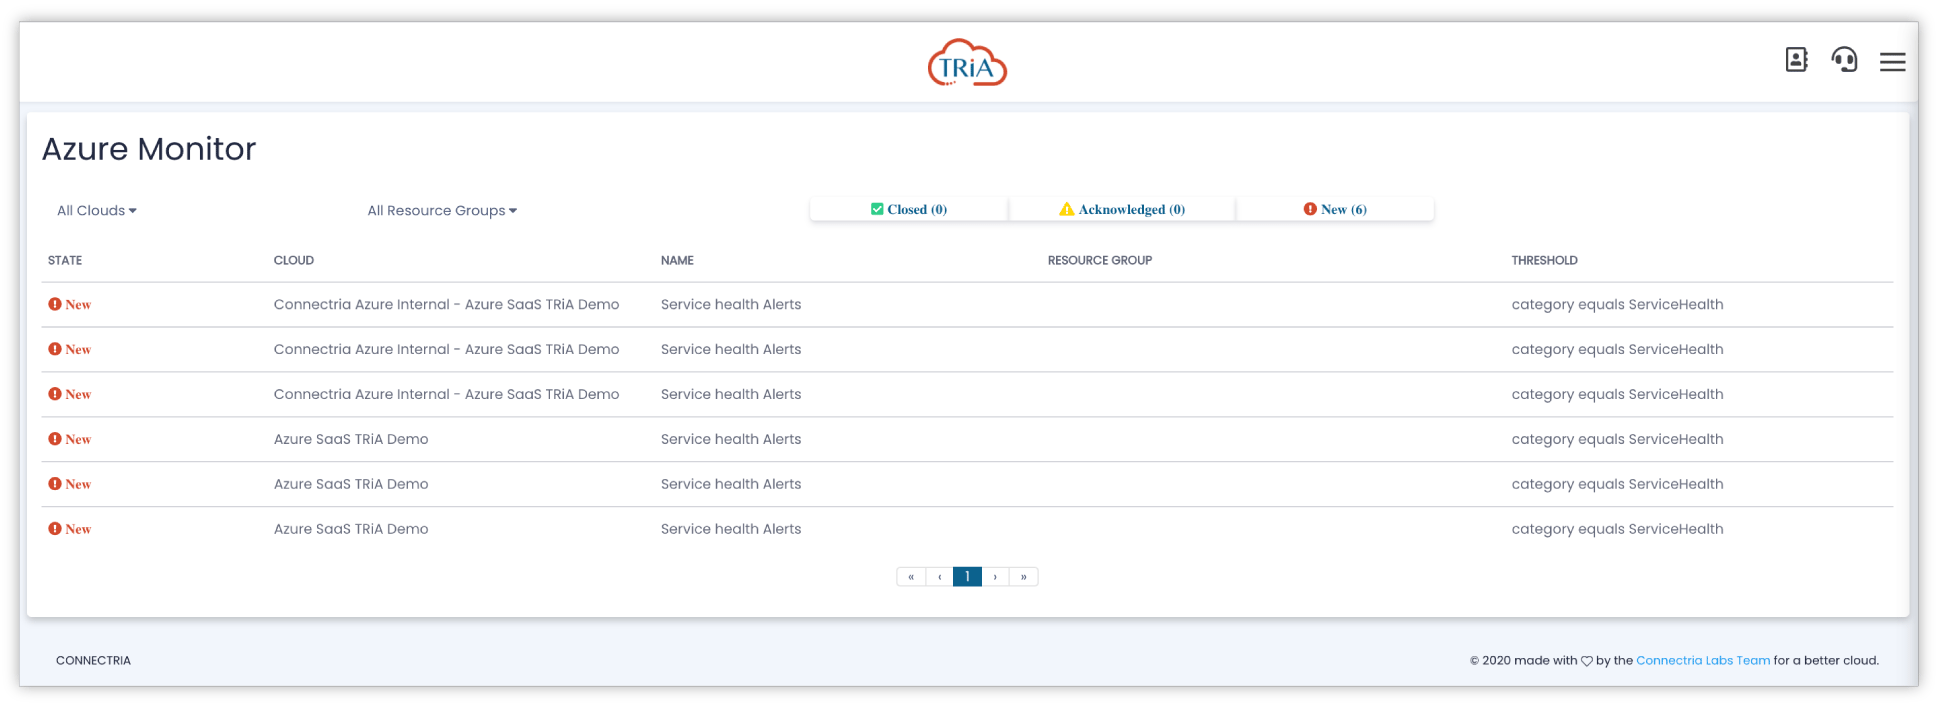
Azure Monitor

Azure Monitor helps you understand how your applications are performing and proactively identifies issues affecting them and the resources they depend on. It surfaces Alarms, Warnings and passed checks.
IBM I LPAR Monitoring
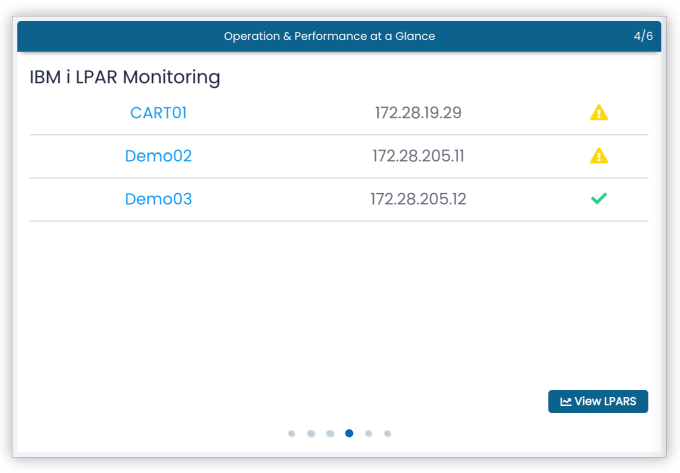
IBM I LPAR Monitoring identifies your Logical Partitions along with their current status. From there you can navigate to the Resource Management IBMi Details view, which provides a central location to quickly ascertain your IBMi-environments’ status, and performance health.
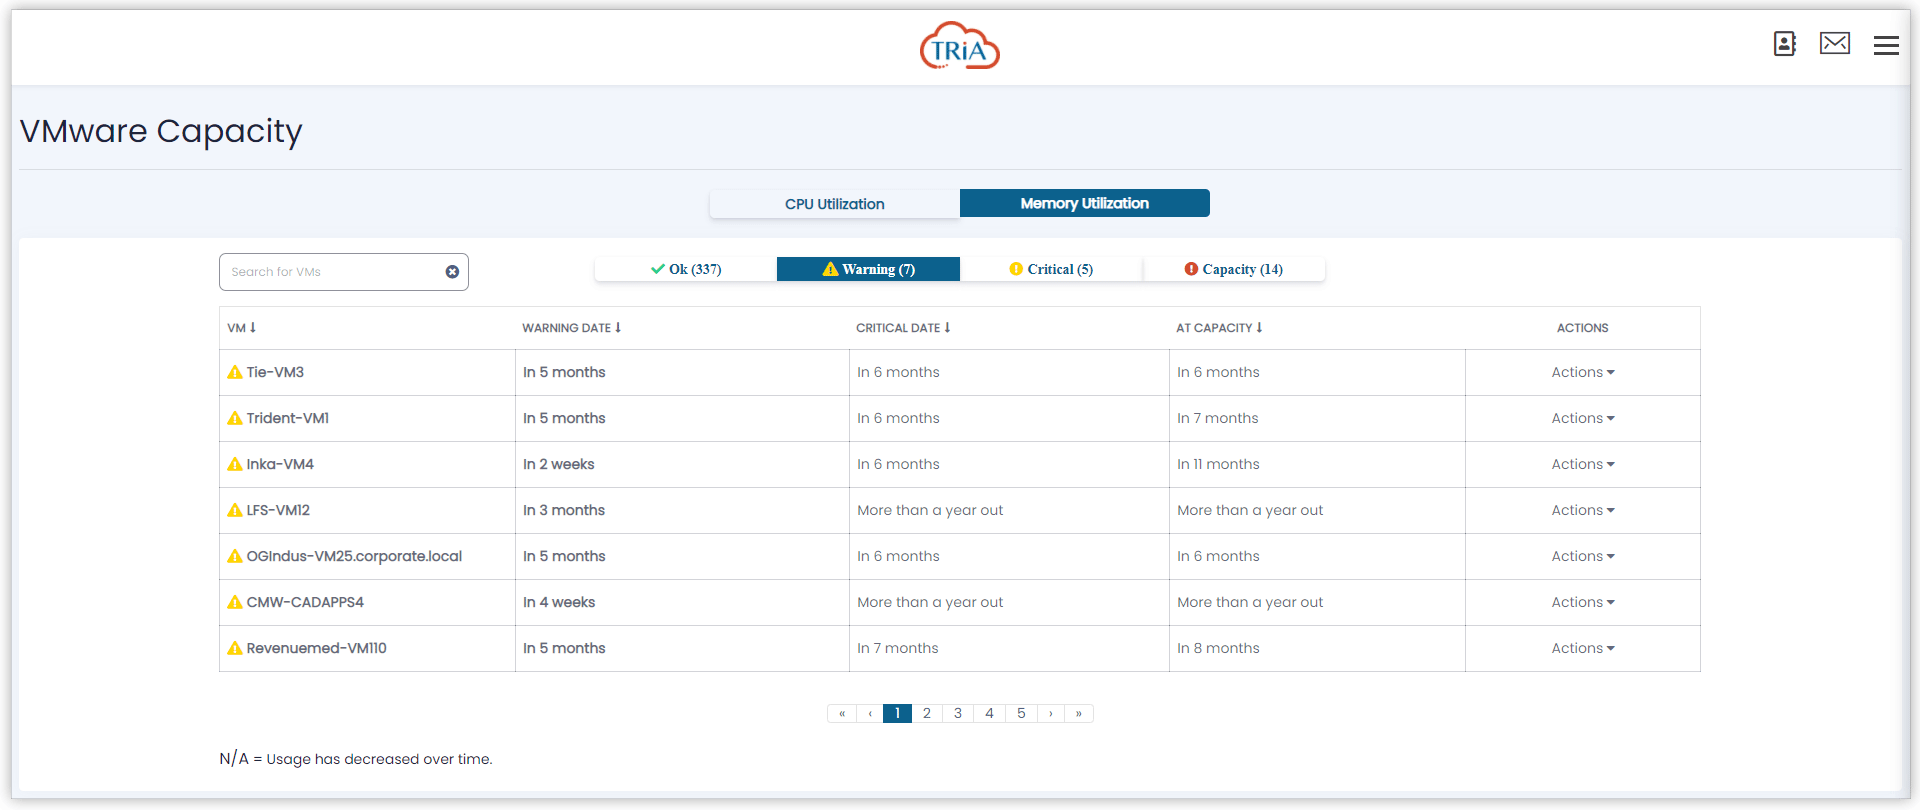
VM Ware Capacity
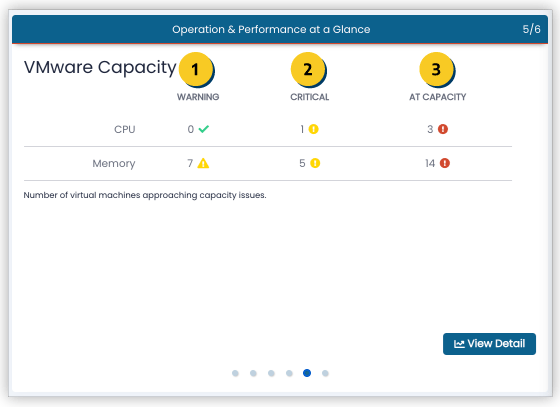
VMware Capacity lists the number of virtual machines encountering warnings , approaching capacity limits or having met or exceeded available capacity . This includes
1 Warnings that are issued when a device exceeds the device’s CPU and RAM Alert Thresholds. These thresholds were set duing your onboarding process. Unless otherwise specified they equate to 90%.
2 Number of instances where VMs are about to reach or have reached critical threshold levels.
3 Number of instances where VMs met or exceeded available capacity.
A comprehensive list, detailing when each warning or alert were generated for both available CPU and Memory capacity are available via the ‘View Detail’ button:
Devices

Devices permit you to navigate to your `Resource Management` VM Ware Devices view.