Resource Management
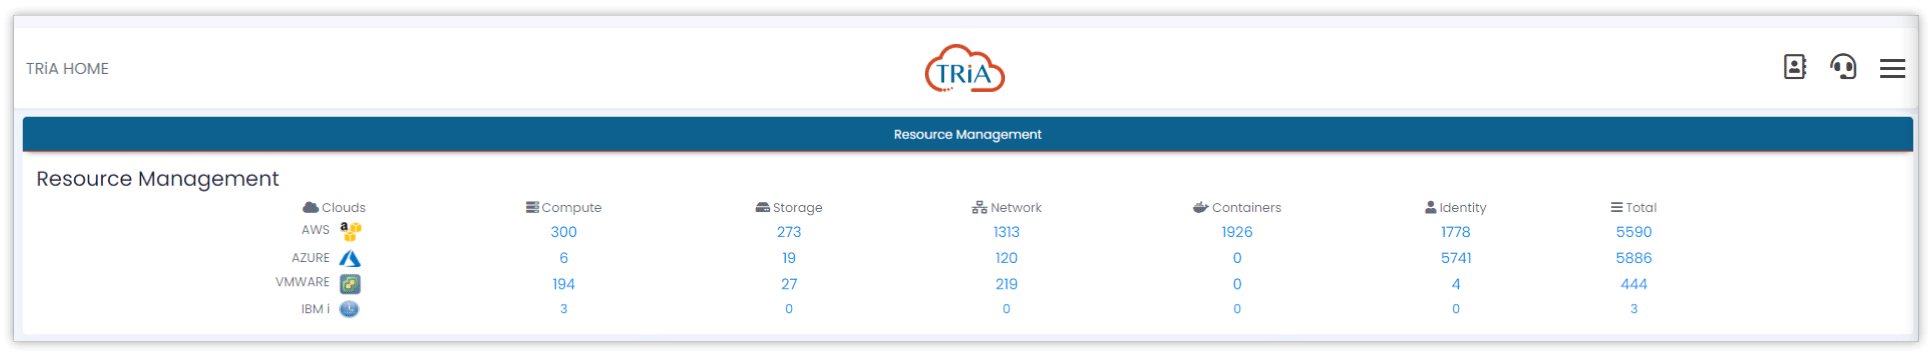
The TRiA Resource Management tab provides a comprehensive overview of all your resources deployed across your Connectria-managed multi-clouds. Supported environments include:
AWS |
|
Azure |
|
Google Cloud |
|
VMware |
|
IBMi |
The table accounts for each resource type that is deployed across your Connectria-managed multi-cloud. This includes:

|
COMPUTE |

|
STORAGE |

|
NETWORK |

|
CONTAINERS |

|
IDENTITY |

|
TOTAL |
From there you can open a detailed view of your deployed resources by selecting any of the clickable numeric table cells. Depending on the cloud-type you will be directed to one of the following views:
for Azure, AWS and Google Cloud Types |
|
for VM Ware deployments |
|
for IBMi deployments |
Resource Management - Cloud Details View
While the Dashboard’s Resource Management Tab provides a numeric footprint of your cloud-resources, the Resource Management Cloud Details View helps you inspect individual resources.
Note
For instance, if you selected the AWS Cell in the Compute Resource column, TRiA will display a Resource Details view that is filtered to display AWS compute resources only.
1 The scope of this view is automatically set to be filtered by the selected resource type.
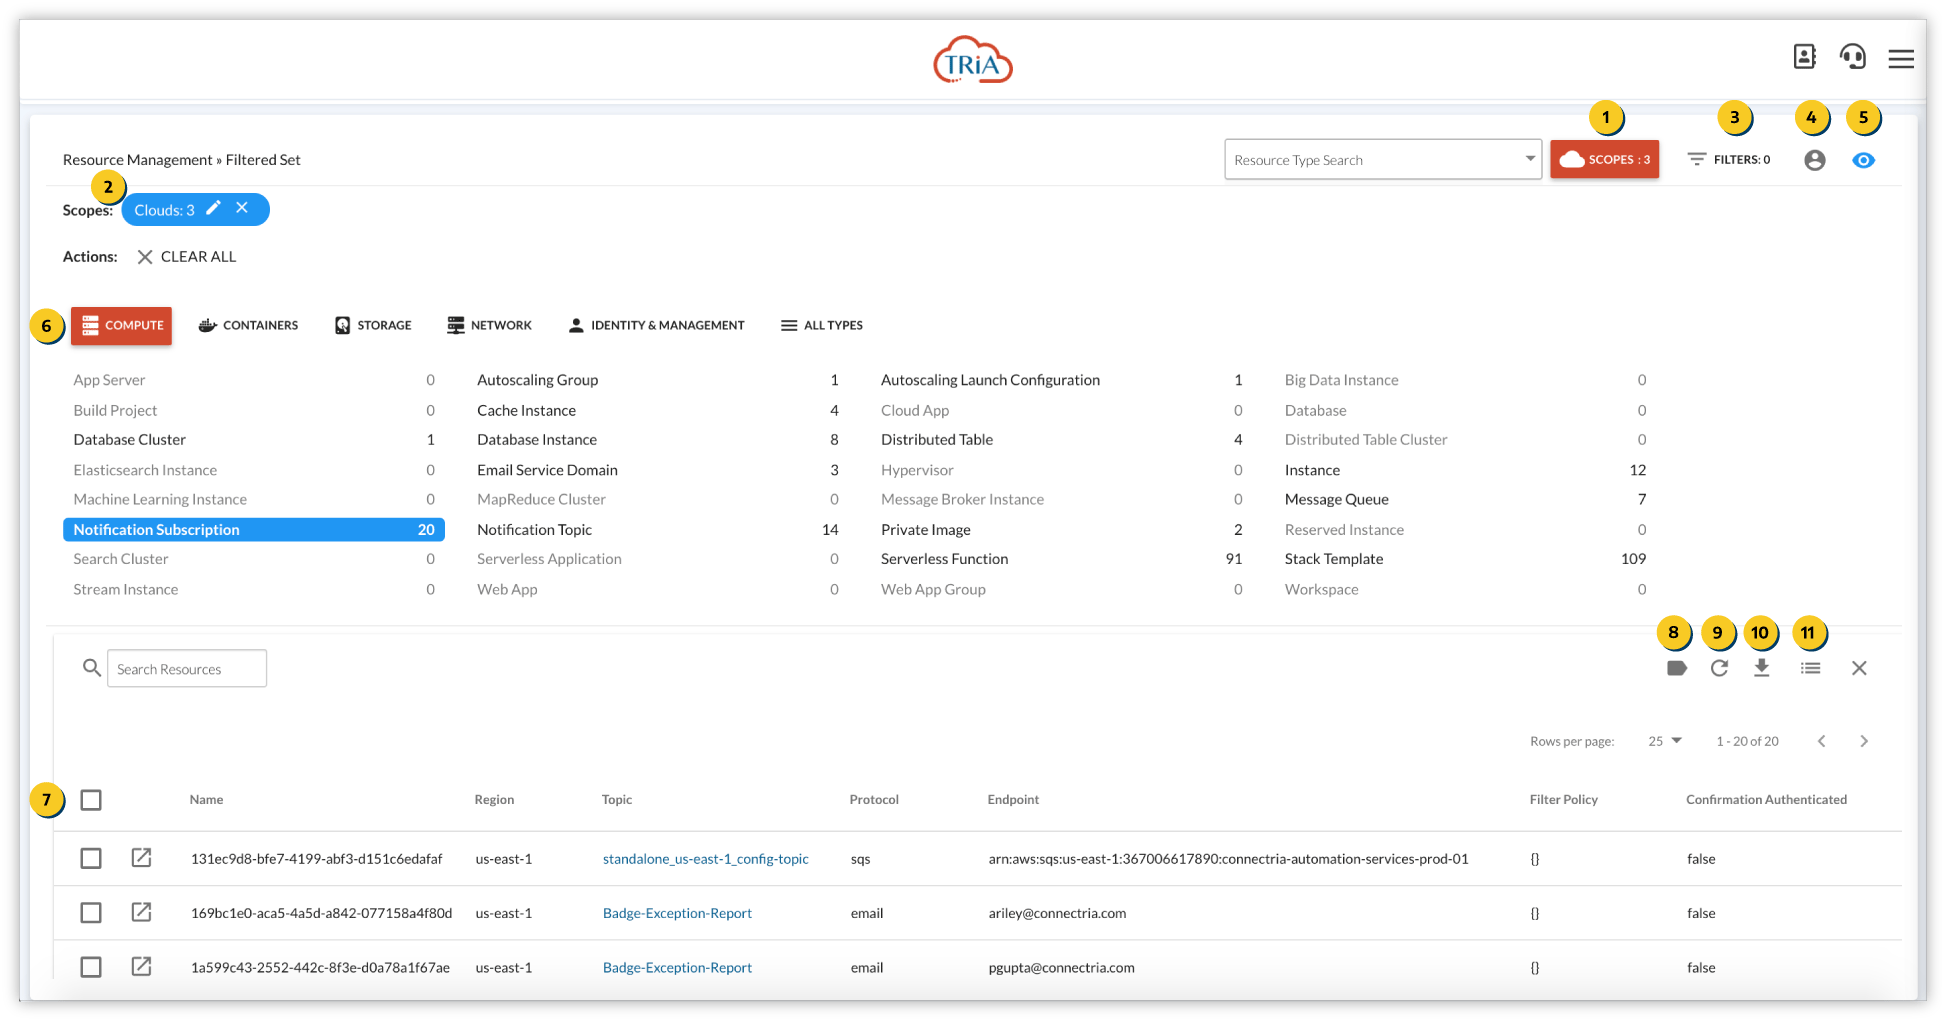
2 Edit or remove the blue scope pill to adjust the previously set scope.
5 You can also toggle the visibility of resource groups on and off.
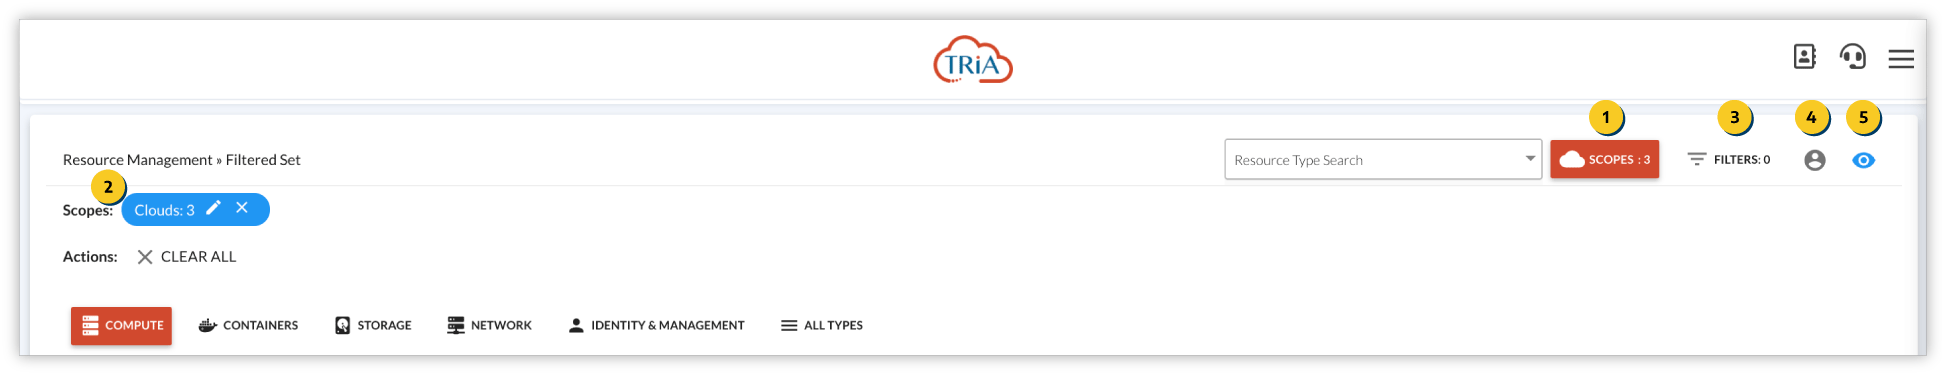
4 In addition you can add bespoke filters to drill down further, or filter resources by those that are owned and/or provisioned by yourself.
7 The displayed list of resource types can be accessed to show a detailed breakout of associated resources.
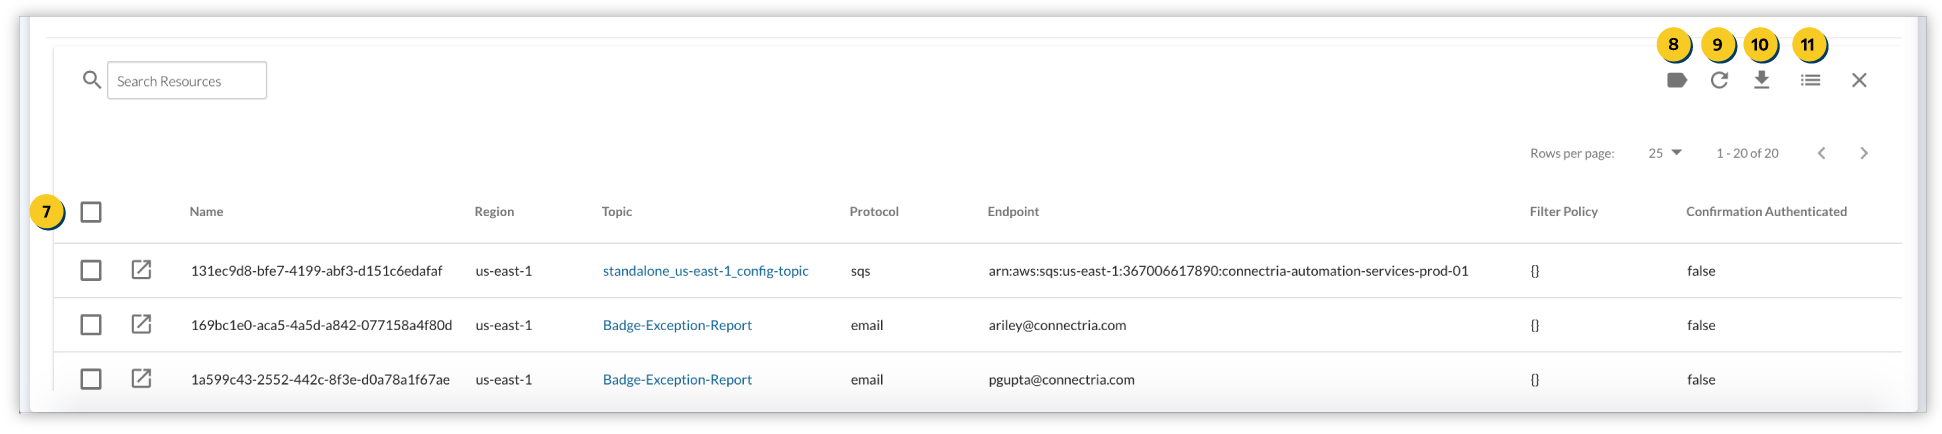
This list can be searched, refreshed 9, downloaded 10 and its columns can be augmented 11.
8 Shown resource items can also be tagged by selecting the tag-button. Resources can be searched and filtered by tag. This introduces a bespoke mechanism to categorize resources beyond cloud-category and resource-type.
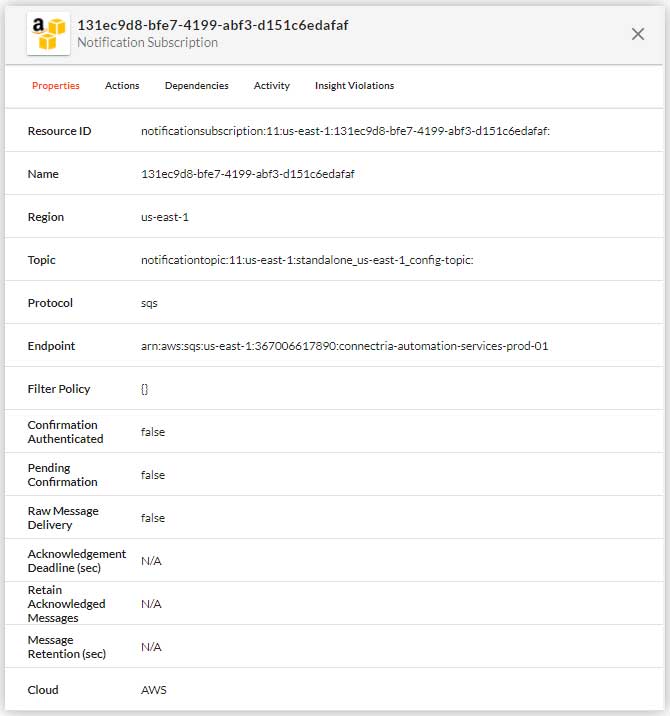
Each resource has several resource properties which can be observed by selecting the resource’s row. Said properties are displayed in the below sidepanel. These include:
Direct URLs
Available Actions
Dependencies
Activity incl. scheduled events & cloud history
Insight Violations
Policies (when relevant)
Custom Policies*
Users (when relevant)
Resource Management - VMware Devices
The Devices View provides a searchable and list of VM Ware devices.
1 The view can be exported to a .CSV.
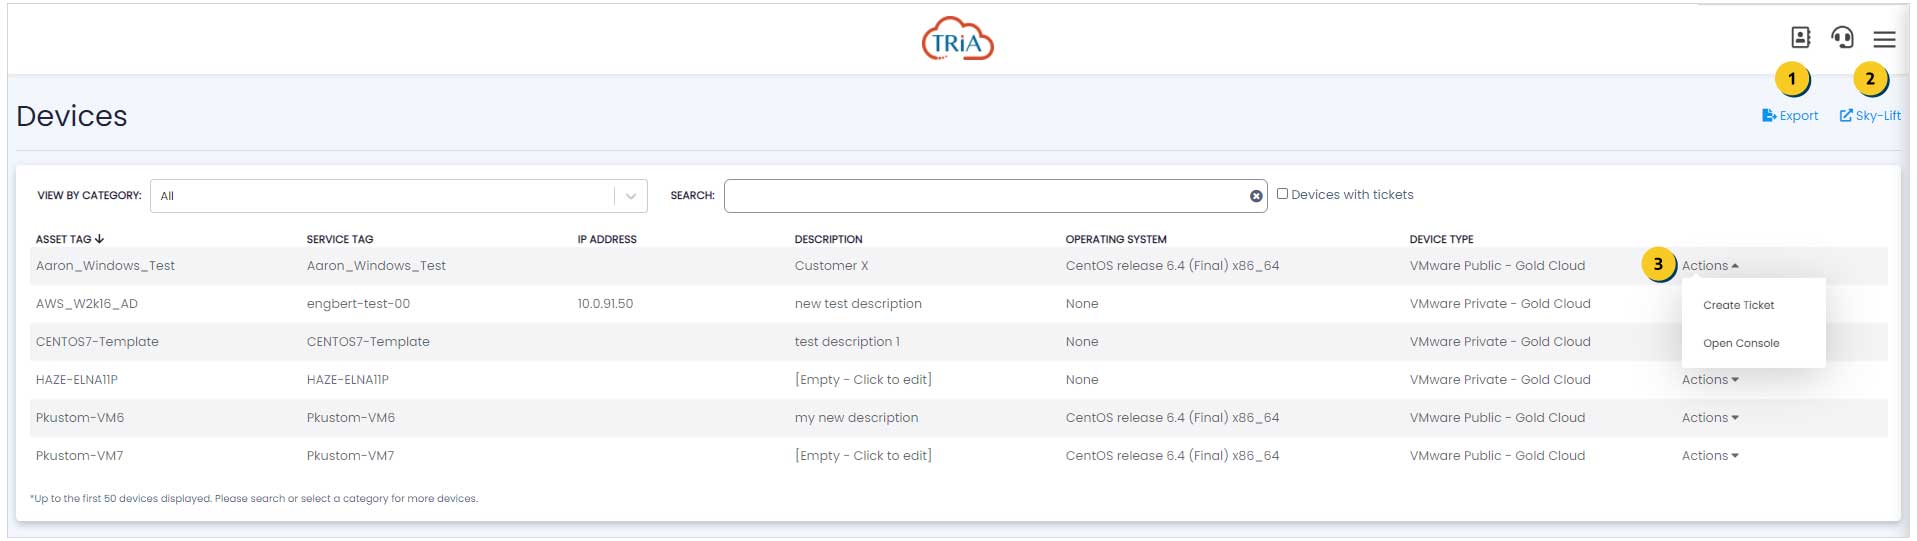
3 The Actions drop down allows you to either `Open a Ticket` or open your `VM Ware Console`. Opening VM Ware console requires MFA, which can be set up by following the subsequent steps outlined after clicking Open VM Ware Console.
2 Alternatively, VM Ware’s Legacy `Sky-Lift` console can also opened.
Resource Management - IBMi LPARS
The `IBMi Dashboard` view provides a central location to quickly ascertain your IBMi-deployments status, and performance health. These metrics automatically refresh every 15 seconds.
1 A countdown indicating the refresh-rate is provided in the top-right corner.
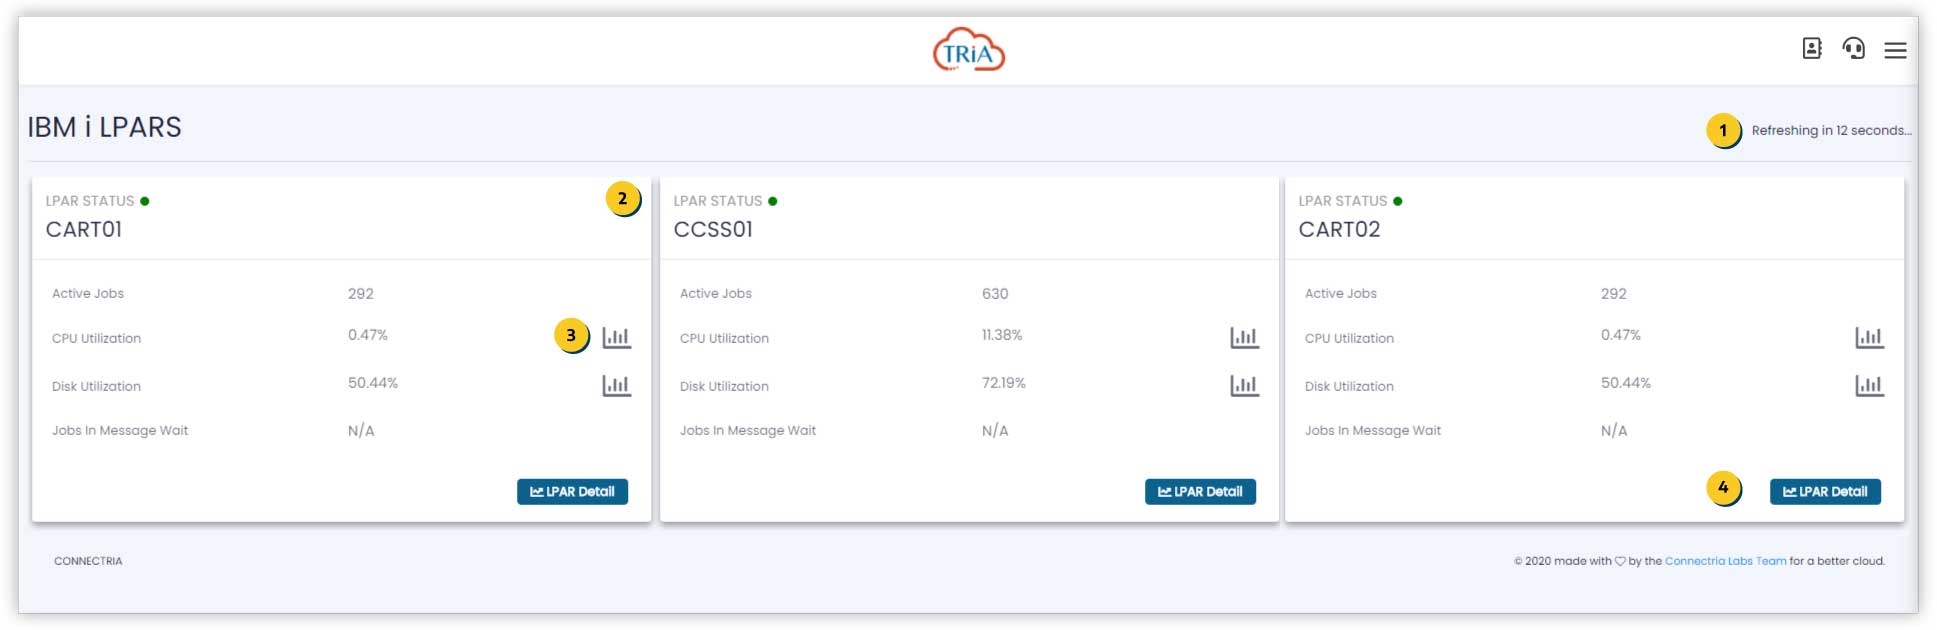
Each Logical IBMi Partition 2 shows:
Value |
Descriptions |
Relevance |
|---|---|---|
LPAR Status |
|
Indicates your LPAR’s current system status |
Active Jobs |
Number of active jobs/ processes |
Indicates the numeric size of your LPAR partition. |
CPU Utilization % |
The calculated CPU time that is derived from the reported consumed CPU time divided by the reported available capacity. |
CPU Utilization constitutes a proxy value for the relative load your system is under. Calculated as a percentage of your LPAR’s overall CPU Capacity, it indicates how close your Logical Partition is to meeting/ exceeding its available compute capacity. |
Disk Utilization |
The calculated Disk Utilization level |
Disk Utilization is an important metric that indicates how much of your Device’s disk memory is in use. |
Jobs in Message Wait |
A job enters the ‘In Message Wait’ status when it is waiting for a response to an inquiry message (MSGW status). This could be because a dependency of this job, hasn’t generated the desired response. |
A high number of ‘Jobs in Message Wait’ may indicate a dependency or computational bottleneck in your system. This can ultimately slow down your system’s efficiency, response times and/or introduce latency. |
3 You can also access a graph visualizing for each of your LPAR’s 'CPU Utilization %' and 'Data Utilization %':
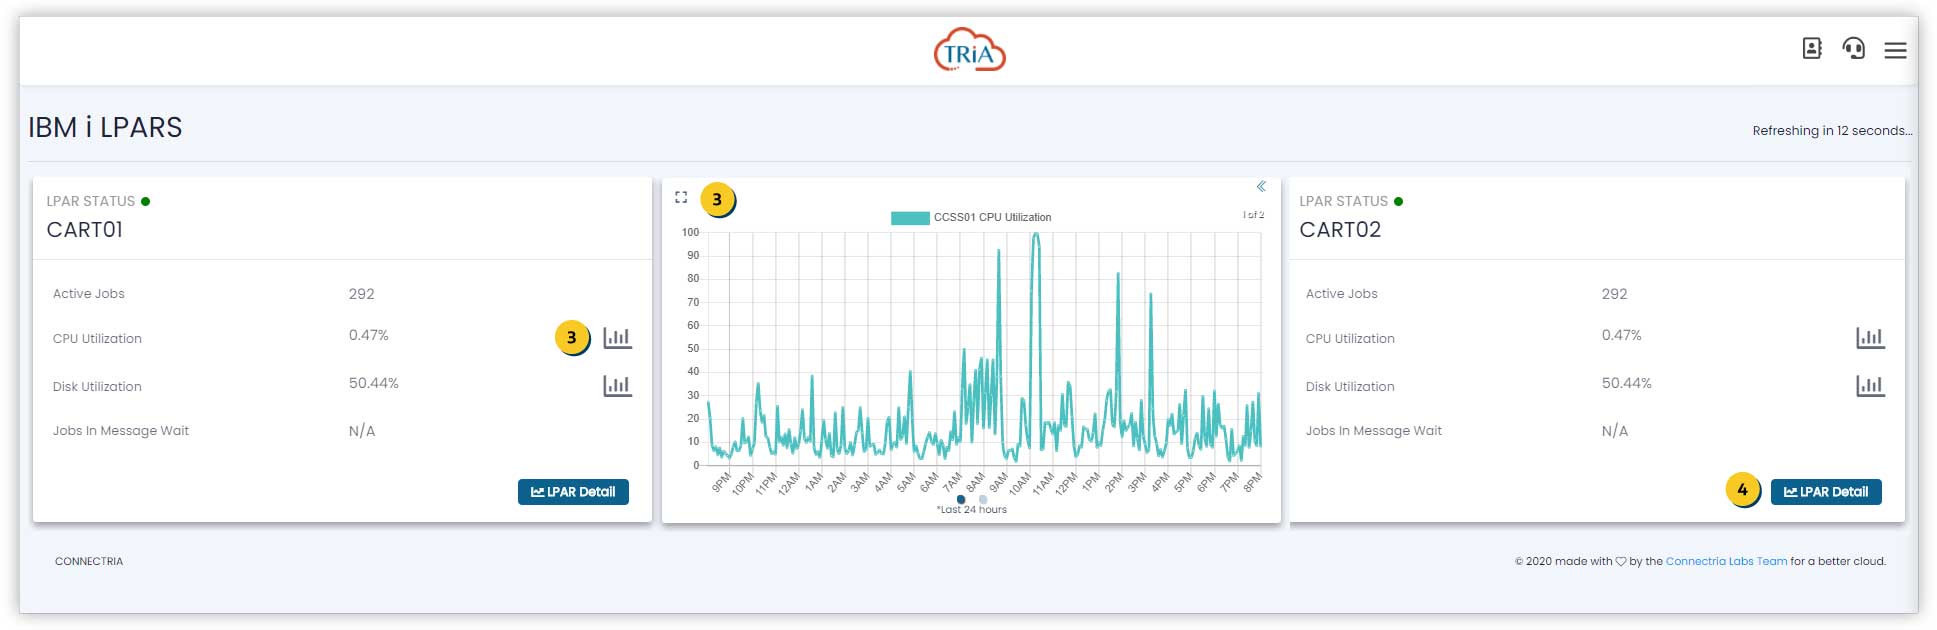
4 You can access more details about your LPAR by selecting the `LPAR Detail` button.
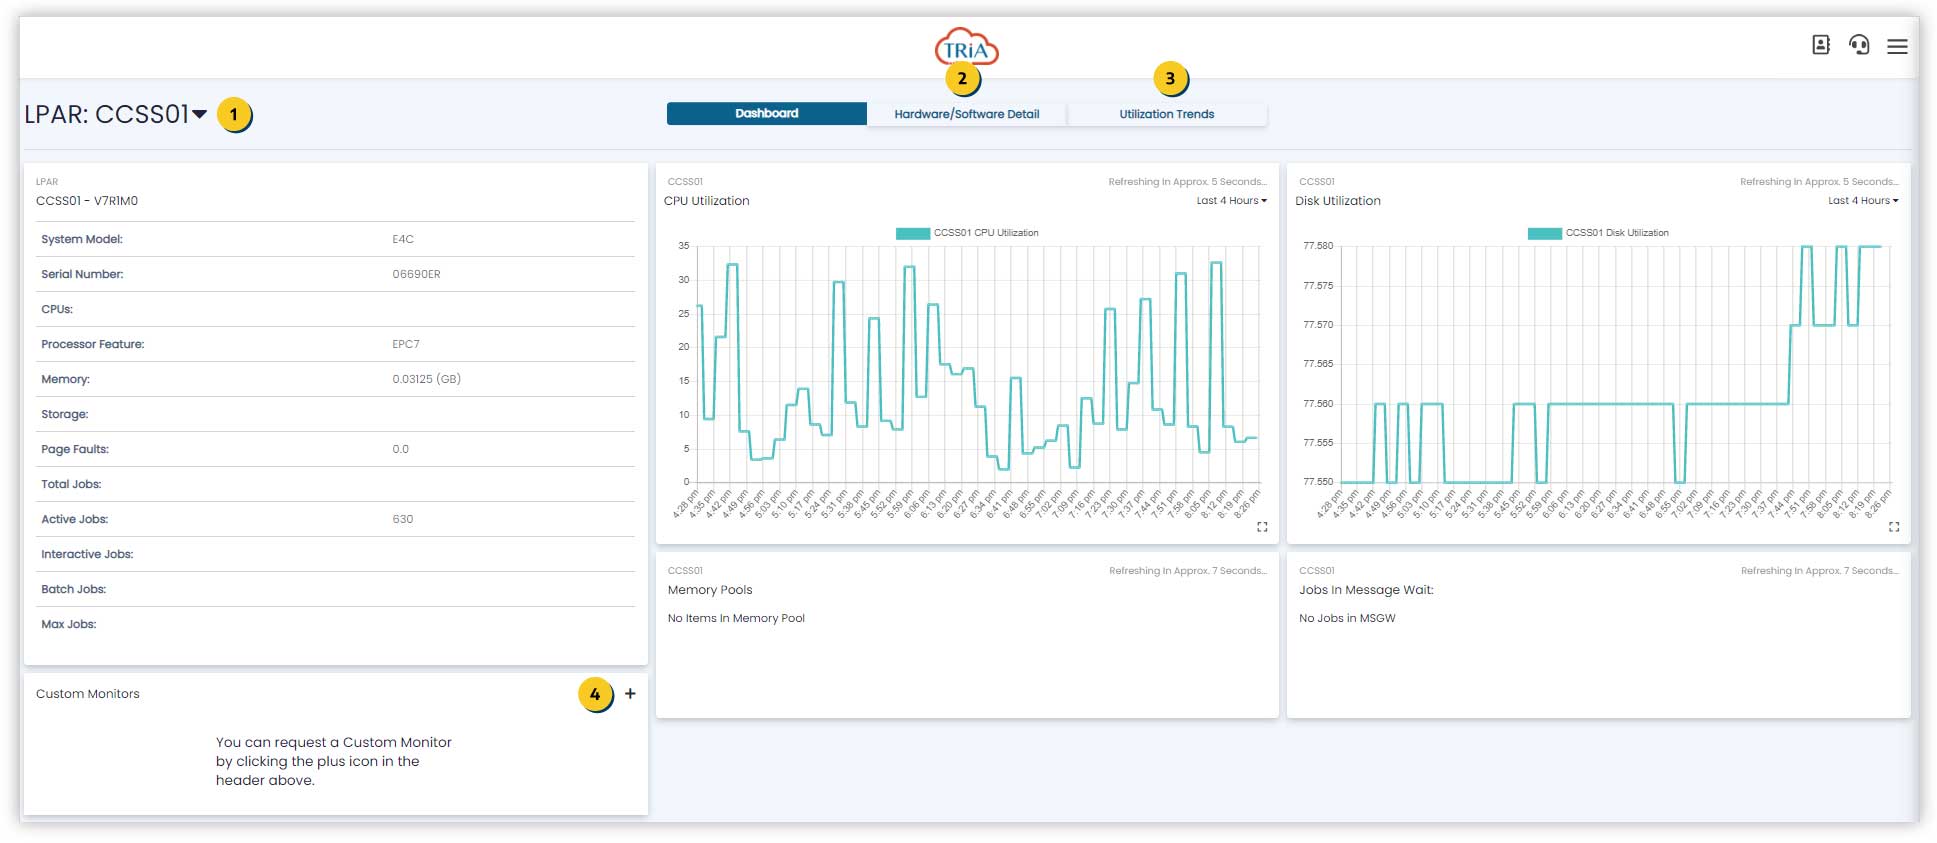
IBMi LPAR Details Dashboard
By default, the LPAR Details View displays basic configuration details along with basic performance indicators for the last 24 hours.
1 You can switch LPAR via the dropdown selector.
These include:
Value |
Descriptions |
Relevance |
|---|---|---|
CPU Utilization % |
The calculated CPU time that is derived from the reported consumed CPU time divided by the reported available capacity. |
CPU Utilization constitutes a proxy value for the relative load your system is under. |
Disk Utilization |
Utilized disk indicates how close your Logical Partition is to meeting/ exceeding its available disk capacity. |
alculated as a percentage of your LPAR’s overall Disk Capacity. |
Memory Pools |
||
Jobs in Message Wait |
A job enters the ‘In Message Wait’ status when it is waiting for a response to an inquiry message (MSGW status). This could be because a dependency of this job, hasn’t generated the desired response. |
A high number of ‘Jobs in Message Wait’ may indicate a dependency or computational bottleneck in your system. This can ultimately slow down your system’s efficiency, response times and/or introduce latency. |
4 You can request for additional monitoring cards to be added by submitting a ticket via the ‘+’ – icon in the Custom Monitoring card.
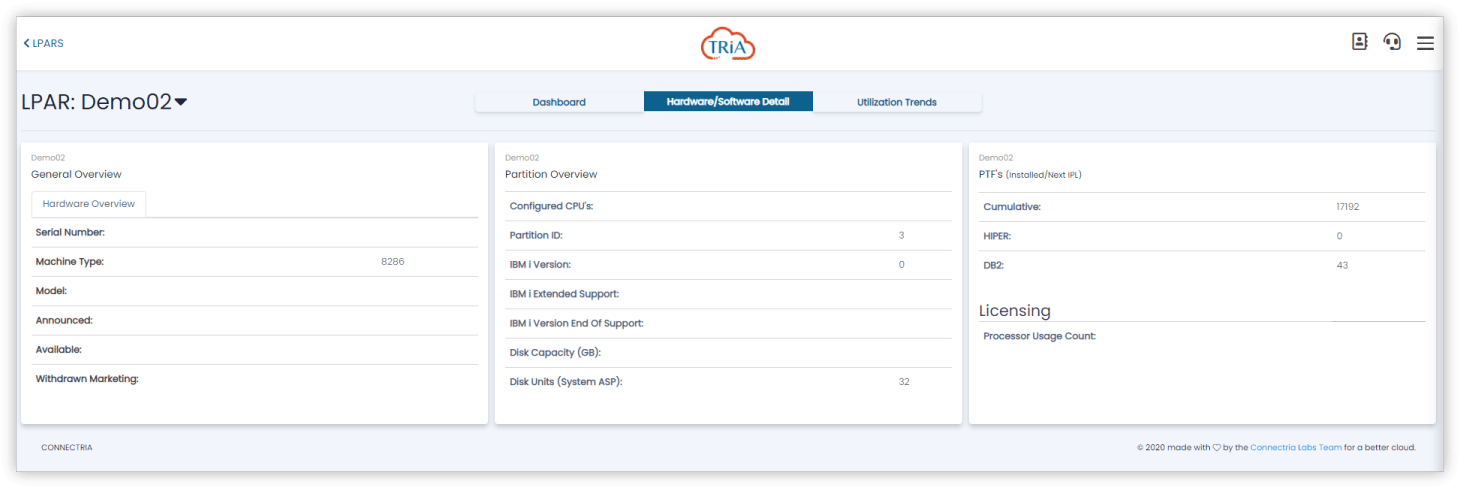
Hardware/ Software Detail
The Hardware/ Software Details tab shows the LPAR’s hardware and software configuration details:
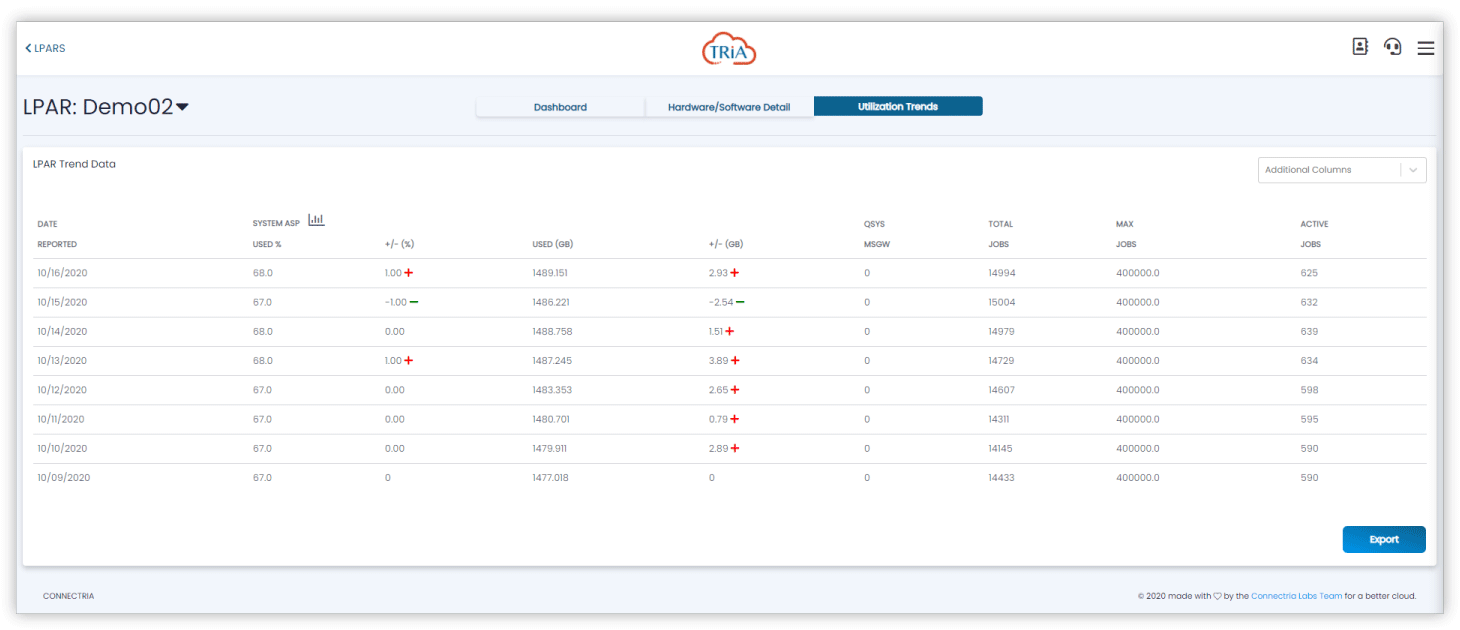
Utilization Trends
Utilization Trends show your LPAR’s ASP Used Disk Space trend as measured in percentage changes and used